What is SDS-PAGE? Principle, protocol and applications
Written by Anina Werner · 06. October 2026
Sodium dodecyl sulfate-polyacrylamide gel electrophoresis (SDS-PAGE) is one of the most widely used methods for analyzing proteins in life sciences laboratories. It provides a fast, accessible way to separate proteins in complex samples, estimate their molecular weight, assess sample purity and quantify proteins. The resulting protein bands also provide material for downstream workflows such as western blotting or mass spectrometry.
This blog discusses how SDS-PAGE actually works – from casting the gel and preparing samples to staining and reading the finished bands – and where the technique fits into broader protein analysis workflows.
Table of contents
SDS-PAGE in a nutshell
SDS-PAGE is an analytical method that uses a porous gel and an electric field to separate the proteins in a sample by size, or more precisely, by molecular weight. The role of SDS is to minimize the influence of a protein's native structure and charge, so that migration through the gel depends primarily on one variable: polypeptide length.
SDS-PAGE is a specific type of gel electrophoresis. Before detailing the method, it's worth clarifying how it differs from agarose gel electrophoresis and native PAGE.
Gel electrophoresis vs agarose gel electrophoresis vs PAGE
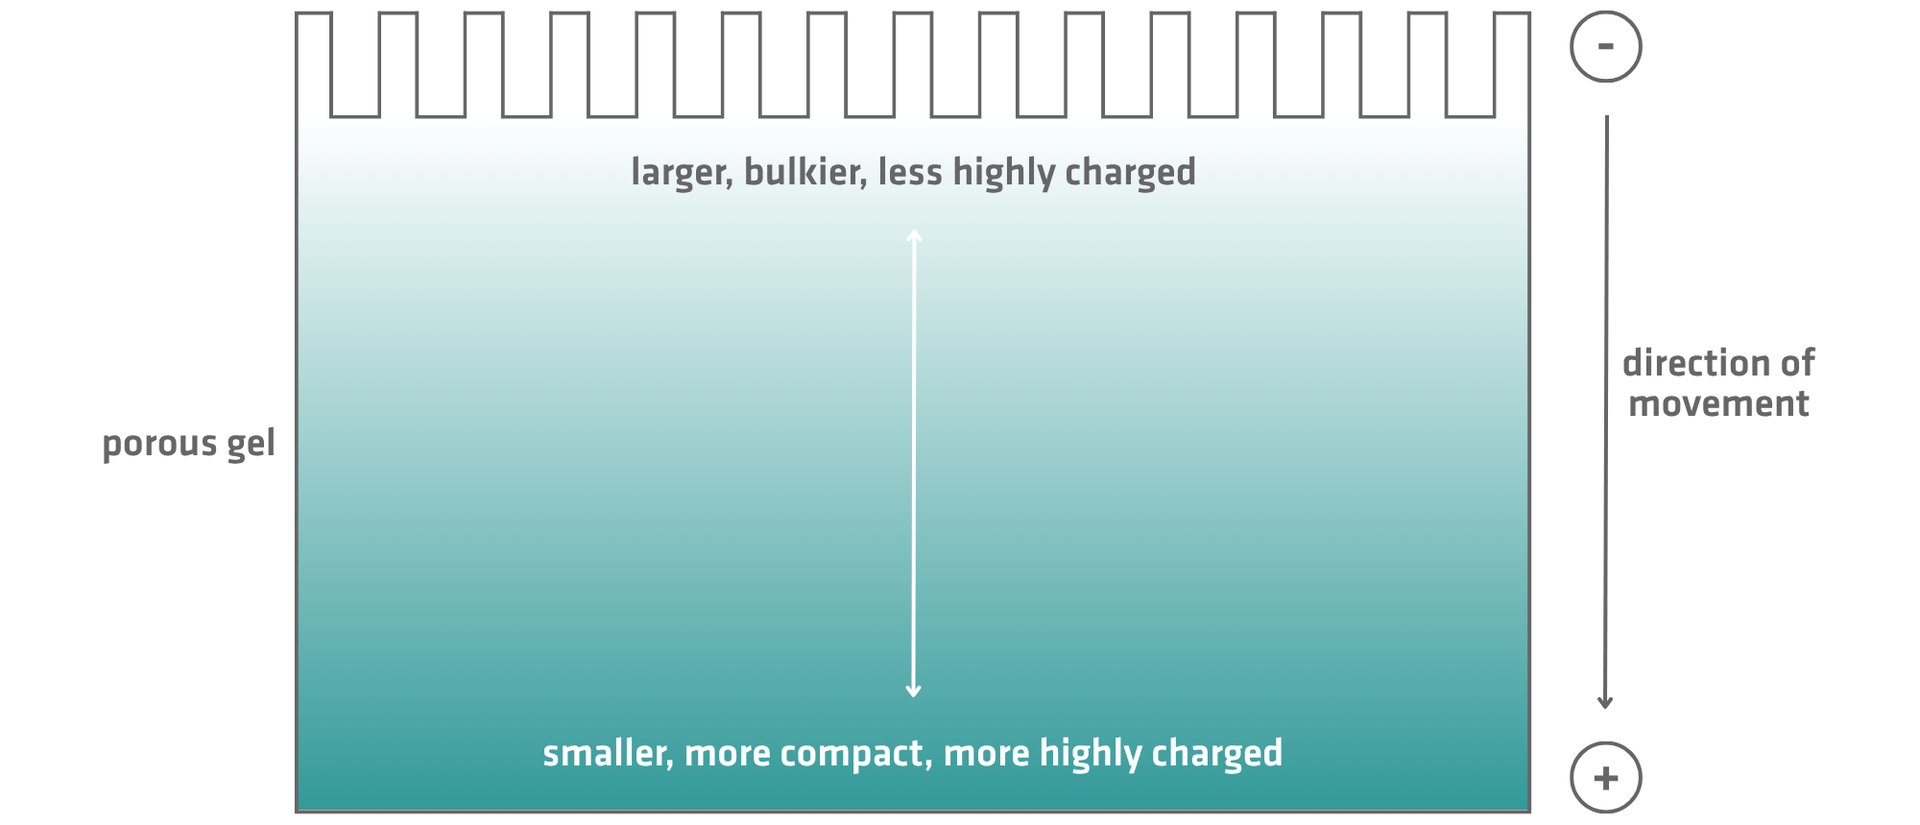
Gel electrophoresis is an umbrella term for a range of methods that separate molecules according to key characteristics – such as size, shape and charge – by pulling them through a porous gel using an electric current. The principle is simple: large or bulky molecules have a harder time travelling through the pores, and molecules with a lower net charge feel less pull toward the electrode. As a result, they migrate shorter distances than small, compact or more highly charged molecules.
The first split within gel electrophoresis is based on what the gel itself is made of, which in turn depends on what's being separated. Agarose gel electrophoresis uses a larger-pored agarose gel, and is the standard choice for DNA and RNA. If you'd like to learn more about the method, our article on DNA quantification covers it in more detail. PAGE, by contrast, uses a finer-pored polyacrylamide gel, and is typically used for proteins. Note that there are exceptions: small DNA and RNA sequences are sometimes separated using PAGE when the pores in agarose gels are too large, and agarose is occasionally used for very large protein complexes when the pores in polyacrylamide gels are too small.
SDS-PAGE vs native PAGE
To make things even more complicated, PAGE itself is also an umbrella term, covering 2 different ways of preparing and separating proteins. Proteins fold into complex 3-dimensional shapes and carry a mix of positive, negative and neutral charges depending on their amino acid sequences. Native PAGE separates them in this state, so their size, shape and charge influence how fast they travel through the gel. The advantage of native PAGE is that a protein's native structure and biological function are usually preserved.
In comparison, SDS-PAGE uses SDS and heat to denature proteins into linear chains, with SDS giving them a uniform negative charge before the sample is run through a gel. This allows proteins to be separated purely by molecular weight, at the cost of their native structure and function.
| SDS-PAGE | Native PAGE | |
|---|---|---|
| Sample treatment | Denatured using SDS and heat | No denaturants |
| Protein structure | Lost | Preserved |
| Basis of separation | Molecular weight only | Combination of size, shape and charge |
| Biological activity | Lost | Often preserved |
| Typical use case |
| Studying protein-protein interactions, native complexes or enzymes that must stay active |
How does SDS-PAGE work?
SDS-PAGE separation depends on 3 parts working together: a gel that acts as a molecular sieve, a sample that's been chemically prepared so that proteins separate primarily by size, and a reference that lets you translate migration distance into an estimated molecular weight. The sections below walk through each part of the process, from casting the gel to reading the finished results.
Gel preparation
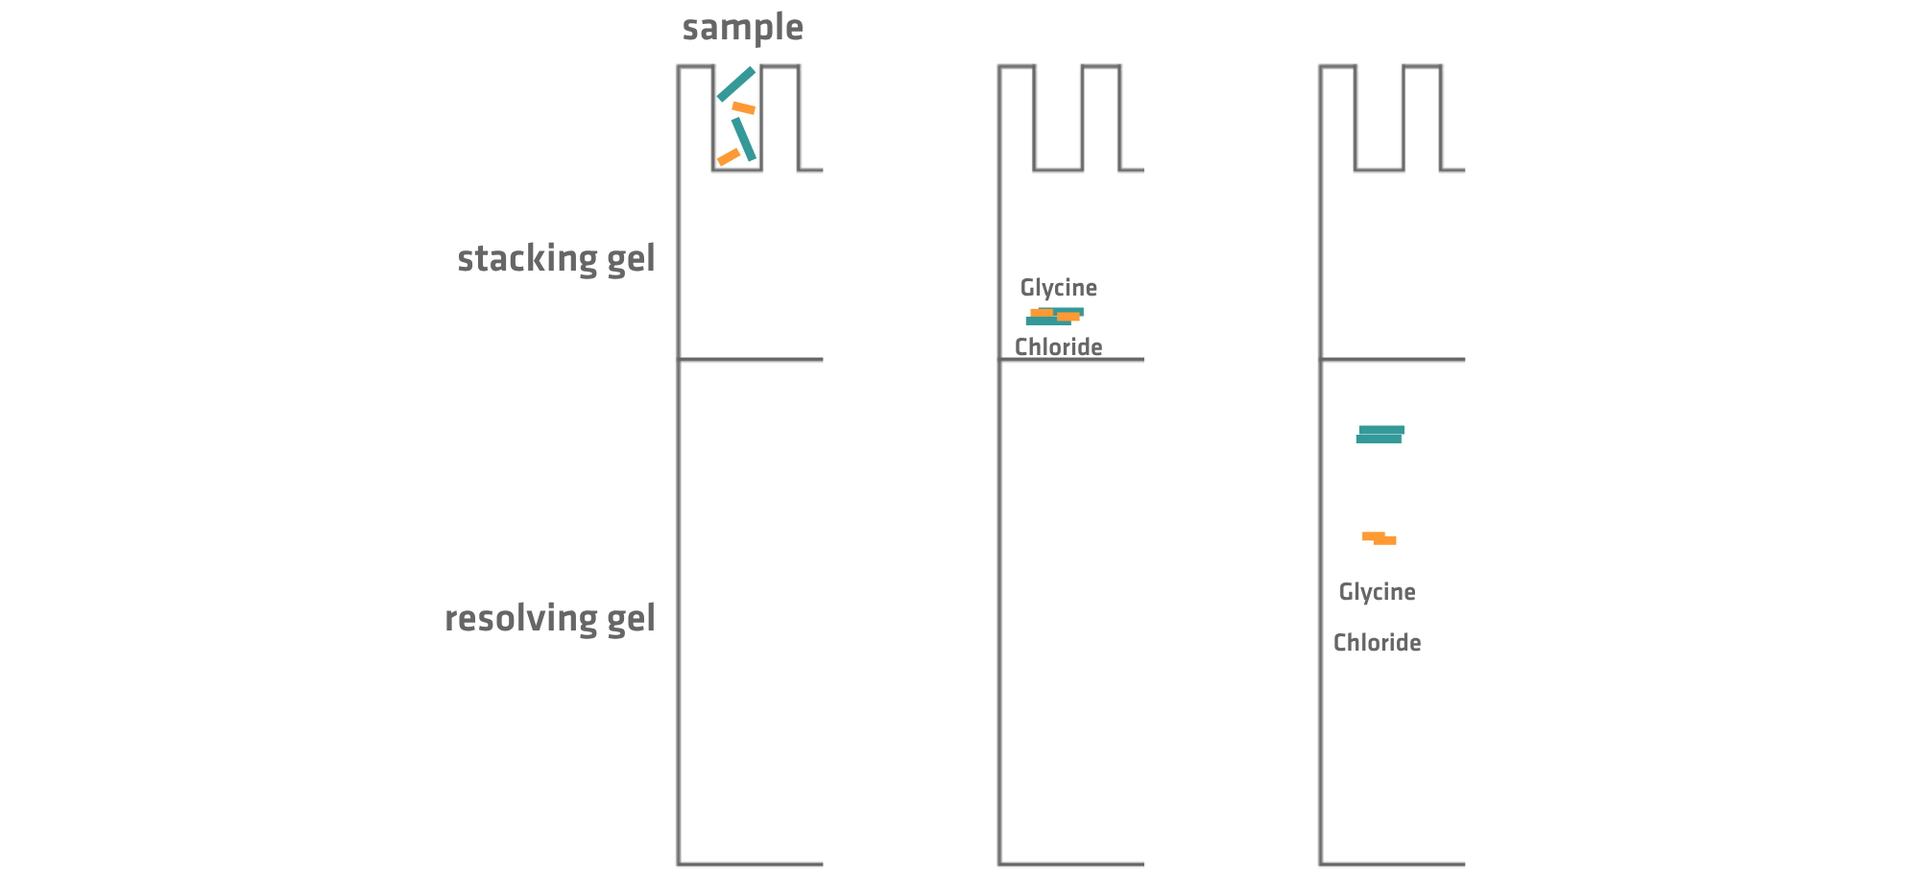
Most SDS-PAGE gels are actually 2 gels stacked on top of each other: a stacking gel sitting above a resolving gel. This solves a practical problem: sample wells are fairly deep, so without a stacking gel, proteins could enter the gel at slightly different times and positions, potentially producing blurry, poorly separated bands. The stacking gel solves this by gathering the proteins into a thin, uniform band before they enter the resolving gel.
The stacking gel has a low acrylamide percentage and therefore relatively large pores, allowing proteins to move through it with very little size-based separation. Instead, it concentrates the proteins into a sharp band using differences in the movement of 2 key components: chloride ions from the Tris-HCl buffer in the gel and glycine from the running buffer.
When an electric field is applied, the chloride ions and glycine move through the stacking gel at different speeds. Chloride ions are small and negatively charged, making them highly mobile, while glycine has a very low net negative charge at the stacking gel's pH of around 6.8, and therefore moves much more slowly. As a result, the chloride ions race ahead while glycine lags behind.
This difference in mobility affects the strength of the electric field across the gel. Regions with plenty of mobile ions conduct current well and have a relatively weak electric field, whereas regions with fewer charge-carrying ions have lower conductivity and therefore develop a stronger one. A narrow, ion-poor region with a strong electric field therefore forms between the chloride ions and glycine, causing the SDS-coated proteins to gather there. If a protein falls behind toward the slower glycine zone, the stronger field accelerates it forward. If it moves too far ahead into the chloride-rich region, it encounters higher conductivity and a weaker field, causing it to slow down. This self-correcting process continually squeezes the proteins together, forming a thin band.
At the beginning of the resolving gel, where the pH is higher at around 8.8, glycine becomes more negatively charged, so it accelerates past the proteins, breaking up the sandwich effect. From there, the higher acrylamide percentage and smaller pores of the resolving gel slow down larger proteins more than smaller ones, allowing the proteins to separate according to molecular weight.1
Gels can be bought precast or produced in the lab. Ready-made cassettes are more consistent and have a longer shelf life, but casting gels by hand is still common in labs running large numbers of standard gels or needing a format that isn't available precast. Gel recipes vary depending on the molecular weight of the protein of interest, the format of the electrophoresis tank and the buffer chemistry, but the basic casting procedure is similar.
- First, assemble the gel cassette using glass or plastic plates and spacers.
- Then, mix the components of the resolving gel, pour the mixture into the cassette, and overlay it with a thin layer of water or isopropanol. This excludes oxygen and helps to create a flat, even surface.
- Once the resolving gel has set – typically after 20-30 minutes – remove the overlay and pour the stacking gel mixture on top.
- Immediately insert a sample comb into the stacking gel before it sets to create the wells for loading the samples.
- After another 20-30 minutes to allow the stacking gel to set, remove the comb and place the cassette in a vertical electrophoresis tank before filling the buffer chambers with running buffer.2
A safety note: unpolymerized acrylamide is a neurotoxin and suspected carcinogen, so it should always be handled with appropriate personal protective equipment.3,4
Sample preparation
Before the protein samples are pipetted into the wells of the gel, they are mixed with a loading buffer containing SDS, an optional reducing agent, glycerol or sucrose and a tracking dye, then heated. In this section, we'll explain what each component of the loading buffer is responsible for.
Proteins are made up of 1 or more polypeptide chains folded into 3-dimensional shapes, held together by hydrogen bonds, hydrophobic interactions, ionic interactions and disulfide bonds.
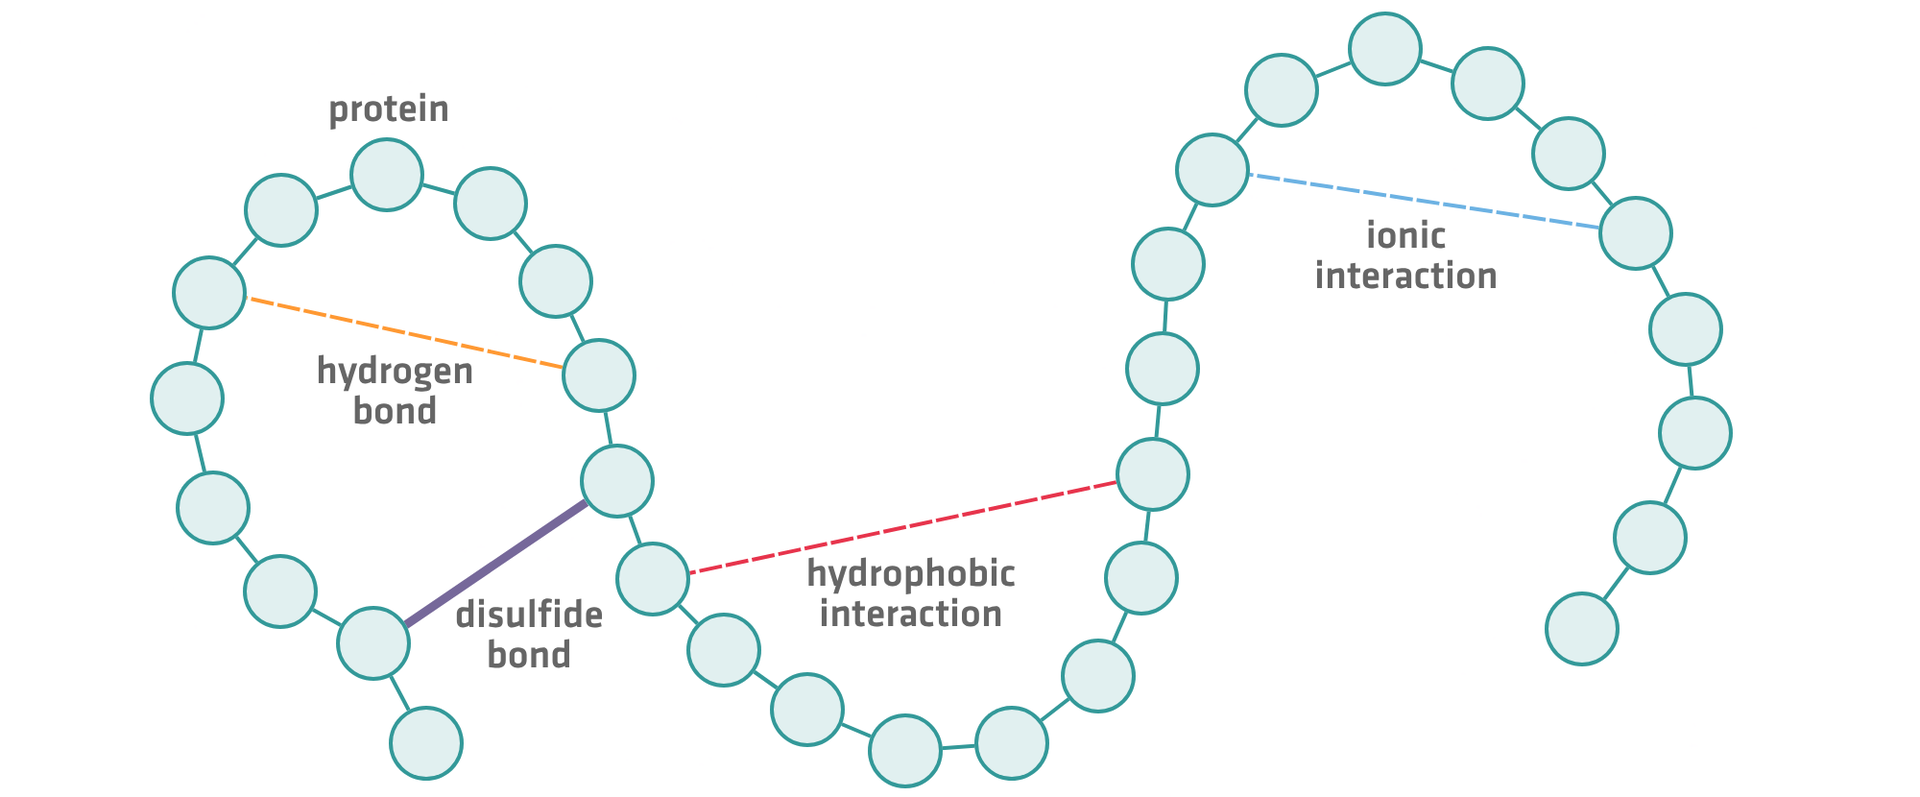
To separate proteins by molecular weight in a polyacrylamide gel, they need to be unfolded into linear chains and given a uniform negative charge. This is achieved using SDS and heat, with a reducing agent such as β-mercaptoethanol (BME) or dithiothreitol (DTT) added when required. SDS and heat denature proteins by disrupting the weaker, non-covalent bonds holding a protein's structure together: hydrogen bonds, hydrophobic interactions and ionic interactions. Reducing agents target something SDS and heat can't fully disrupt on their own: covalent disulfide bonds. If a protein consists of more than 1 polypeptide chain and is separated into individual chains by SDS, heat and a reducing agent, each chain will produce a separate line in the gel later on.
Once a protein has been unfolded into 1 or more linear chains, SDS's hydrophobic tails bind to hydrophobic regions along the polypeptide chain(s), providing a negative charge. Because SDS binds to proteins at a fairly constant ratio – roughly 1.4 g of SDS per gram of protein, or about 1 SDS molecule per 2 amino acids – the protein's own intrinsic charge becomes negligible compared to the uniform negative charge contributed by the bound SDS.5

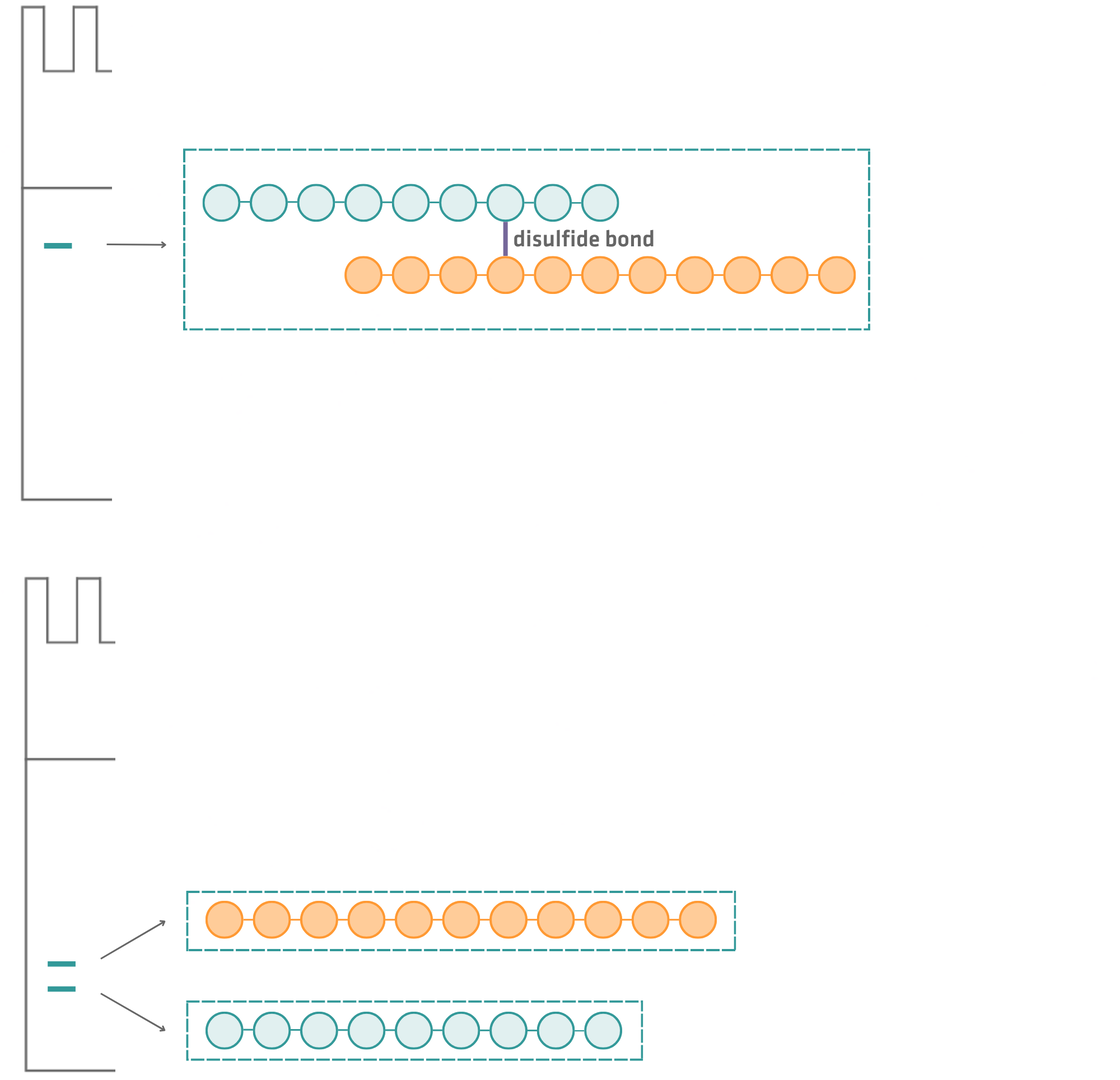
Note that a reducing agent isn't strictly required for SDS-PAGE. Using only SDS and heat to denature the sample is called non-reducing SDS-PAGE, as opposed to reducing SDS-PAGE. Reducing SDS-PAGE is the more commonly used approach, but non-reducing SDS-PAGE has specific applications, such as assessing whether an antibody's disulfide-bonded chains remain correctly linked after storage. If the chains are still correctly linked, a single protein band with a high molecular weight is obtained, whereas 2 bands with lower molecular weights can indicate that the disulfide bonds are no longer intact.
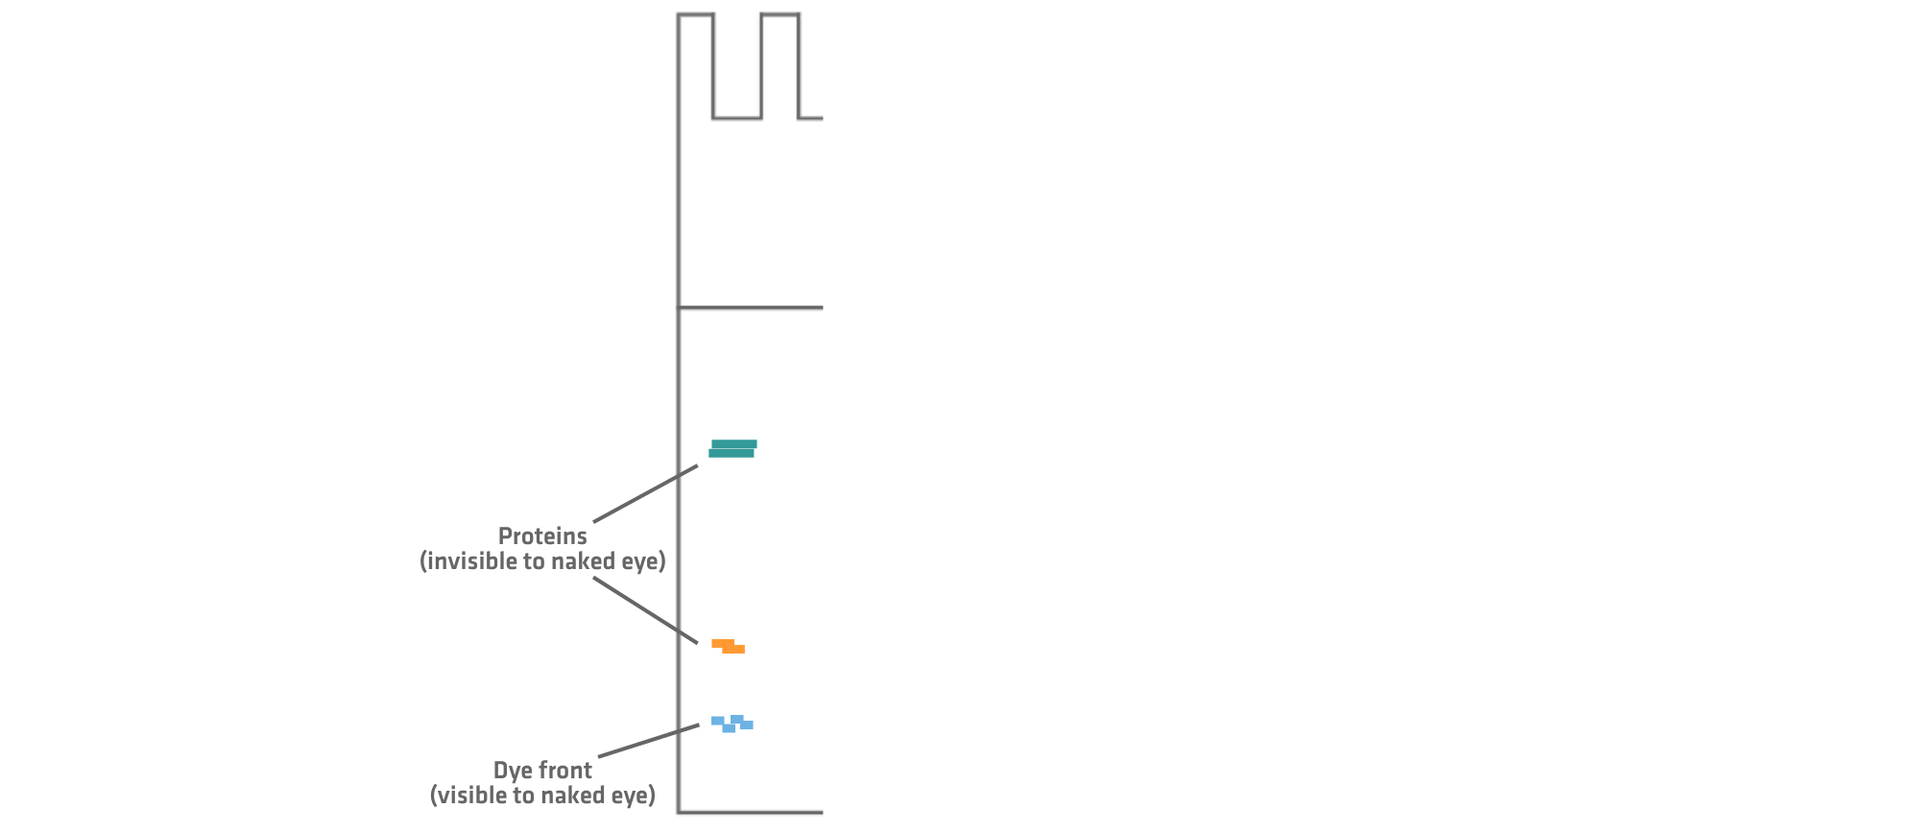
The remaining loading buffer components don't act directly on the proteins, but they still serve important functions. Glycerol or sucrose is added to increase the density of the mixture, ensuring that it sinks to the bottom of the well rather than diffusing into the running buffer after being pipetted into the gel. The tracking dye makes the samples visible during loading and allows you to monitor their progress through the gel as the SDS-PAGE run progresses. It is negatively charged at the running pH, so it migrates toward the bottom of the gel and provides a visible dye front that shows you when to stop the run. Because dyes differ in how fast they move through the gel, the right choice depends on the size range of the proteins being separated: the dye needs to migrate ahead of the smallest protein of interest, or that protein risks running off the bottom of the gel before the dye front signals that it's time to stop. Bromophenol blue is the standard choice for typical protein samples, xylene cyanol can be used when working with larger proteins that call for a slower-moving marker, and orange G can be used for very small peptides that require a faster dye front.
Once the samples have been prepared, they are loaded into the wells of the gel, usually alongside a protein ladder (see the next section for more details). A constant voltage is then applied, causing the negatively charged SDS-protein complexes to migrate toward the positive electrode at the bottom of the tank. The run continues until the tracking dye front nears the bottom of the gel.
A quick note on sample handling: highly concentrated protein samples and glycerol- or sucrose-containing loading buffers are viscous, and standard pipette tips can under-deliver these solutions due to liquid retention on the inner tip wall. We've previously discussed how low retention tips reduce variability for exactly this kind of concentrated, viscous sample, which is worth bearing in mind when consistent, well-defined bands matter for downstream quantification.
More information on pipetting viscous liquids can be found in this video.
Protein ladders as a reference
The distance a protein migrates through the gel depends on its molecular weight but isn't an absolute measurement, so every gel needs a reference. An SDS-PAGE ladder – also called a molecular weight marker or standard – is a mixture of proteins of known molecular weights that is loaded into its own lane alongside the samples.
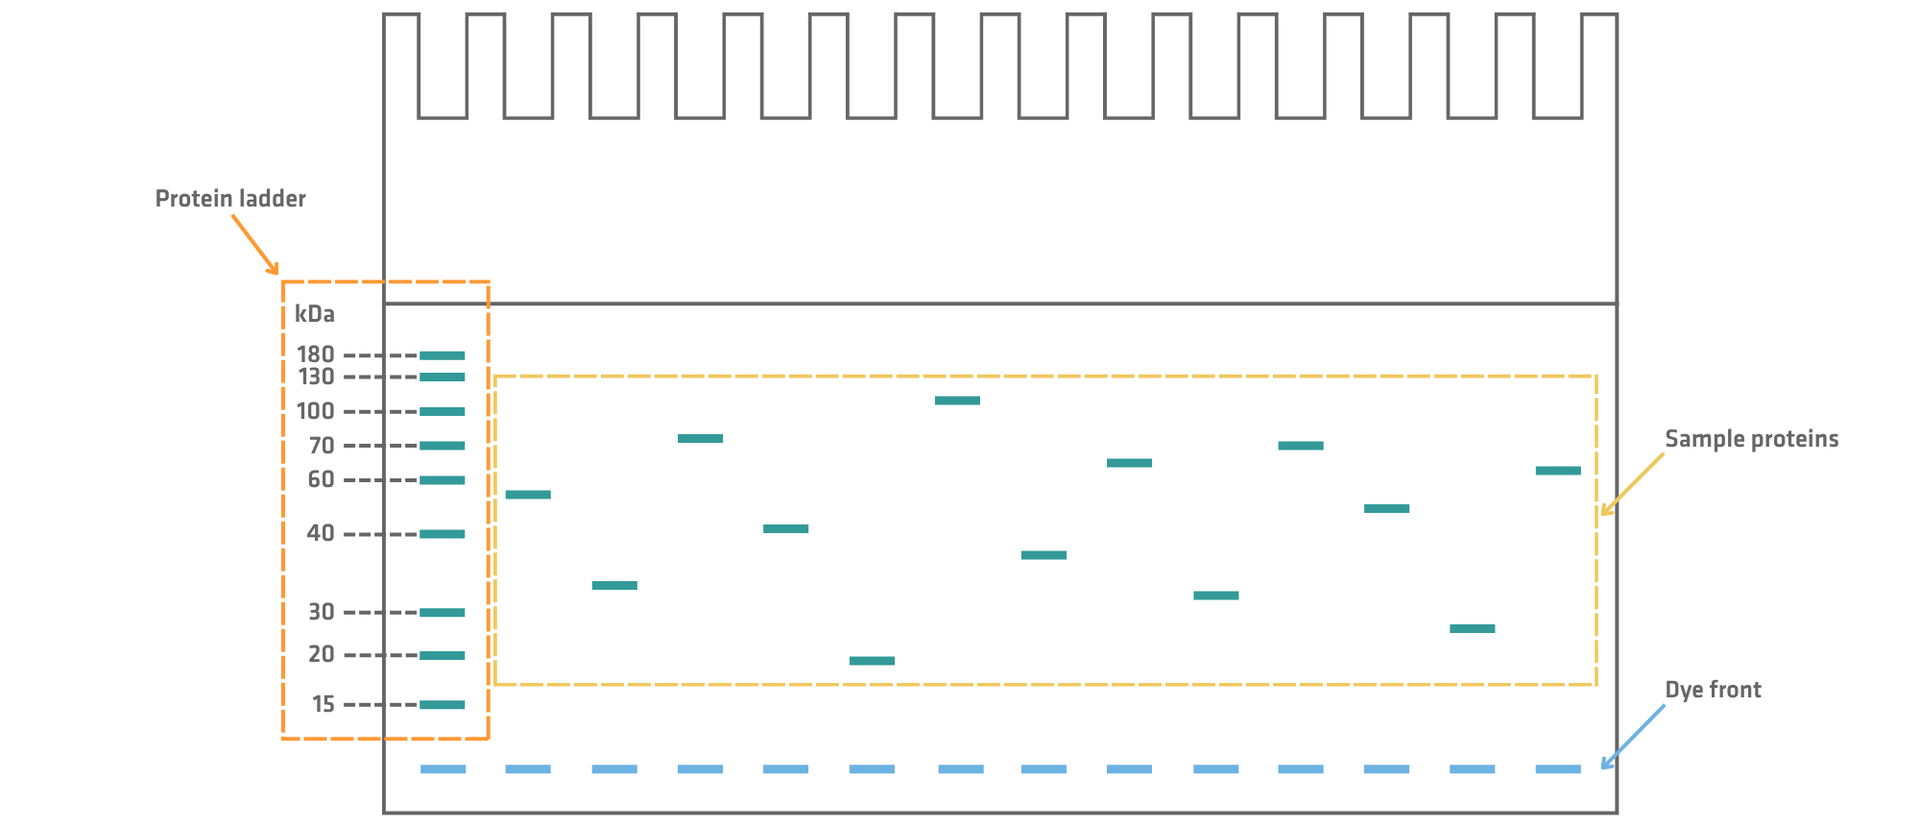
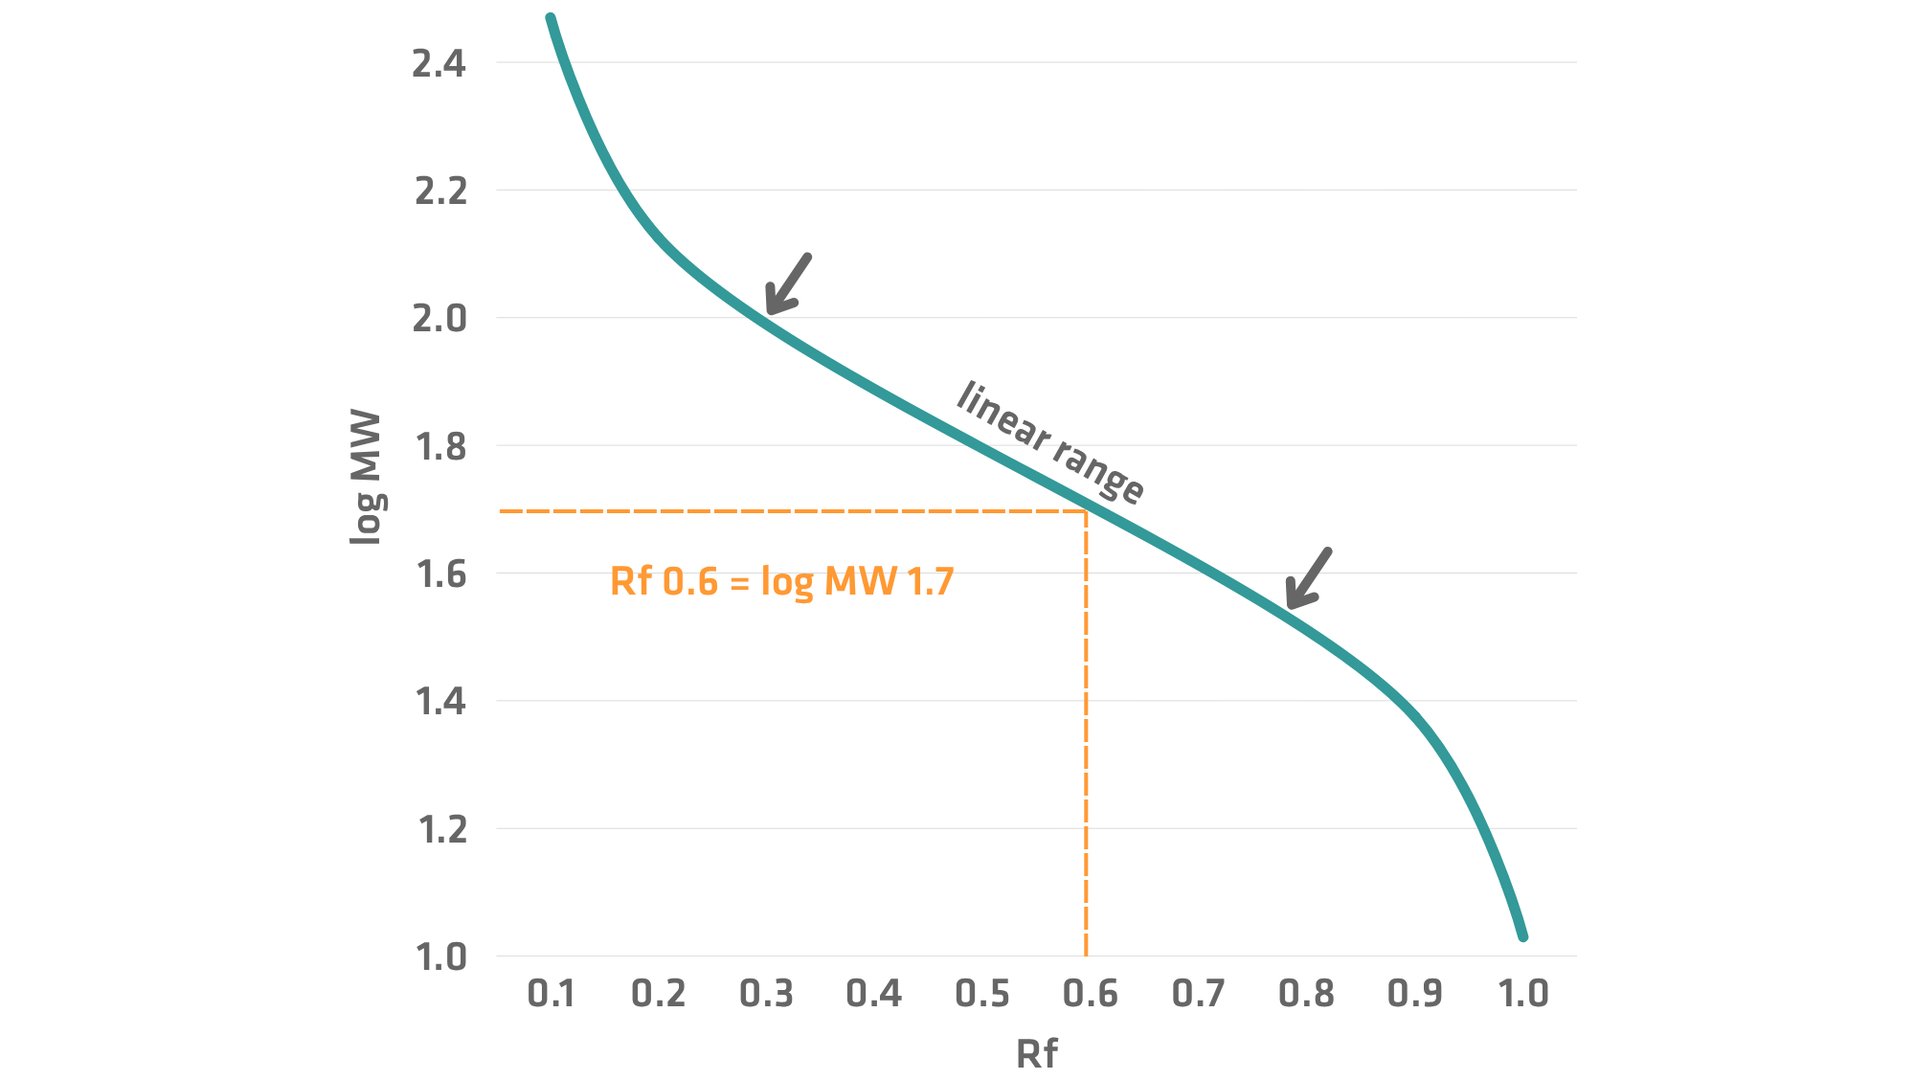
After the run, the log10 of each ladder protein's known molecular weight can be plotted against its migration distance to produce a roughly linear standard curve within the resolving range of the gel. This curve can then be used to estimate the molecular weights of proteins in neighboring sample lanes. More details on this can be found in the next section.
Staining and analysis
Once electrophoresis is complete, the gel is removed from its cassette and the proteins within it are visualized. The most common general purpose visualization method is Coomassie Brilliant Blue staining. This starts with a fixation step, where the gel is treated with a methanol and acetic acid solution that precipitates and aggregates proteins to prevent them from moving freely through the pores of the gel. The gel is then soaked in the dye solution, allowing dye molecules to bind to the proteins. Finally, the gel is destained or washed to remove excess unbound dye until the protein bands appear as sharp blue lines against a clear background.
Once a gel has been stained, SDS-PAGE analysis can extract 2 main pieces of information: the approximate molecular weight of the proteins present and an indication of sample purity. A single sharp band at the expected molecular weight indicates a high degree of purity, while multiple bands can indicate that additional proteins and/or contaminants are present. To estimate molecular weight, the relative mobility (Rf) of each ladder and sample band is calculated as the distance the band has migrated divided by the distance traveled by the dye front:
Rf = distance migrated by protein / distance migrated by dye front
Plotting the log10 of the known molecular weights (log MW) of the ladder proteins against their Rf values produces a curve that is approximately linear across the middle of the gel's resolving range. This relationship becomes non-linear at the largest and smallest molecular weights, where the sieving effect of the gel becomes too strong or too weak to discriminate effectively. Interpolating an unknown protein's Rf from this curve provides an estimate of its molecular weight.
Applications
So how is SDS-PAGE used in the lab? Its everyday use can be grouped into 4 main applications: assessing protein purification, protein quantification, western blotting and sample preparation for mass spectrometry.
Assessing protein purity and identity
SDS-PAGE is one of the fastest ways to check the success of a protein purification workflow. A single, sharp band at the expected molecular weight is a good sign that the target protein has been successfully isolated, whereas additional bands may indicate other proteins or degradation products still present in the sample. For a broader look at how purified protein samples are generated in the first place, see our guide to protein purification methods.
Determining protein quantity
SDS-PAGE can also estimate how much of a protein is present. After staining, band intensity generally reflects the amount of protein a sample contains, so measuring the intensity using densitometry and comparing it with a standard curve built from known protein amounts can provide relative or absolute estimates of protein quantity. This can be useful for tracking and optimizing recombinant protein production in cells, for example, by comparing expression levels under various experimental conditions.
The first step of western blotting
SDS-PAGE is also the separation step in western blotting, a technique used to detect a specific protein within a complex mixture. Once proteins have been separated by molecular weight on the gel, they are transferred to a membrane and probed with an antibody specific to the protein of interest. A common real-world example is food allergen testing, where a separated sample is probed with antibodies against a known allergen, such as a peanut or milk protein. If the allergen is present in the sample, these antibodies will bind and can subsequently be detected. If you would like to know more about western blotting, please refer to our article ELISA vs western blot.
Sample preparation for mass spectrometry
SDS-PAGE is often used as an upstream separation step before mass spectrometry, when the application's goal is to identify an unknown protein. After the gel has been run and stained, the band of interest is excised and subjected to in-gel digestion: an enzyme – typically trypsin – cuts the protein into smaller peptides directly within the gel piece. These peptides are then extracted and analyzed by mass spectrometry, which measures their precise masses. The resulting data can be compared with protein sequence databases to help identify the unknown protein.
Conclusion
SDS-PAGE won't tell you everything about a protein, as it can't confirm identity on its own, and destroys the native structure and activity needed to study protein function. However, it provides a fast and accessible way to assess protein purity and estimate molecular weight. By denaturing proteins and giving them a broadly uniform negative charge, SDS-PAGE minimizes the influence of their native shape and charge, leaving migration distance as a clean, size-based readout that you can compare against a ladder. From there, band intensity can be used to estimate protein quantity, and the separated proteins can also be taken forward into western blotting and mass spectrometry workflows.
Ask our expert. Leave a comment!
Write us if you have any questions regarding the blog article.